Questions on the Mathematica Stack Exchange, Part 2
This is an extension on my previous post about digging through the Stack Exchange. If you want some more background head there.
Last time we briefly looked at how questions tracked with Mathematica release dates. Today we’ll look at how time of posting correlates with question score and with answer score.
First off, let’s get all our answer data:
$so = ServiceConnect["StackExchange"];
$answers =
   $so["QueryIterate",
     "Request" -> "Answers",
     "site" -> "mathematica"
     ];
$answers // Length

(*Out:*)

66546
And export it like before:
KeyChainConnect[];
CloudExport[$answers, "MX", "user:b3m2a1/mse_answers_list.mx",
 Permissions -> "Public"]

(*Out:*)

CloudObject["https://www.wolframcloud.com/objects/b3m2a1/mse_answers_\
list.mx"]
And we’ll import the old questions:
$questions = CloudImport["user:b3m2a1/mse_question_list.mx"];
Now let’s build an EventSeries over the questions and answer scores:
questionScores =
  EventSeries@
    AssociationThread[
      FromUnixTime /@ Lookup[Normal[$questions], "creation_date"],
      Lookup[Normal[$questions], "score"]
      ]

(*Out:*)
answerScores =
  EventSeries@
    AssociationThread[
      FromUnixTime /@ Lookup[Normal[$answers], "creation_date"],
      Lookup[Normal[$answers], "score"]
      ]

(*Out:*)
Note that the answers extend a bit further, and we could import the new data. Or we could just chop both EventSeries and, given my laziness (and that you, dear reader, don’t want to look at more boring code) we’ll do the latter.
questionScores =
   TimeSeriesWindow[
   questionScores, {DateObject[{1970}], DateObject[{2017, 6, 30}]}];
answerScores =
   TimeSeriesWindow[
   answerScores, {DateObject[{1970}], DateObject[{2017, 6, 30}]}];
Cool. Now they treat the same time span, so we can begin. Before any real work, though, let’s just look at what we have here:
Map[
   {DateListPlot[#, PlotRange -> All],
    Histogram[#["Values"], PlotRange -> All]} &,
   {questionScores, answerScores}
   ] // Grid

(*Out:*)
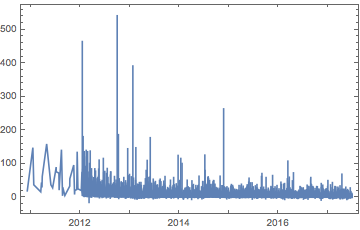
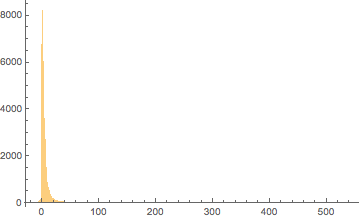
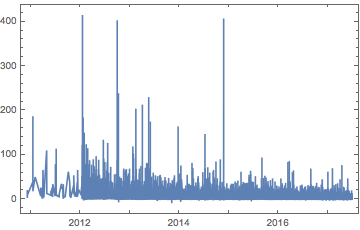
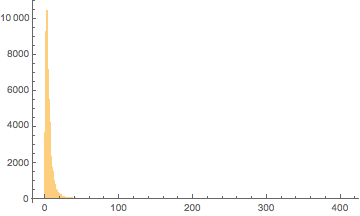
We can see that:
-
Scores peak very strongly for both in the 1-5 range
-
Answer scores appear to be higher than question scores on average
And these observations are borne out by testing:
questionScores["Values"] // Median
answerScores["Values"] // Median

(*Out:*)

3

(*Out:*)

4

questionScores["Values"] // Mean // N
answerScores["Values"] // Mean // N

(*Out:*)

4.58619

(*Out:*)

5.32322
Score as a Function of Time of Day
We’ll start by simply sampling every day down to its time component
dateHMReform[dates : {__DateObject}] :=

  TimeObject[#, TimeZone -> -4.] & /@
     Thread[
       {
         DateValue[dates, "Hour"],
         DateValue[dates, "Minute"],
         DateValue[dates, "Second"]
         }
       ];

questionHMScores =
   EventSeries[
   Thread@{dateHMReform[questionScores["Dates"]],
     questionScores["Values"]}];
answerHMScores =
   EventSeries[
   Thread@{dateHMReform[answerScores["Dates"]],
     answerScores["Values"]}];
DateListPlot[#, PlotRange -> All] & /@ {answerHMScores,
   questionHMScores} // Column

(*Out:*)
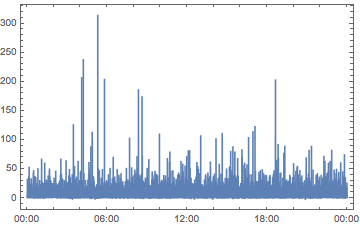
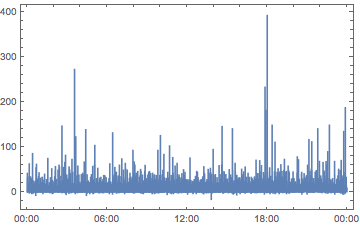
And… all we see is noise. So let’s restrict ourselves to the questions and do a simple smoothing:
smoothQHMS =
  MovingMap[Mean, questionHMScores, Quantity[1, "Hours"] ];
smoothQHMS // DateListPlot[#, PlotRange -> All] &

(*Out:*)
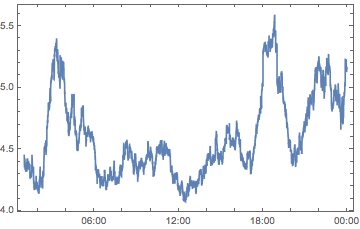
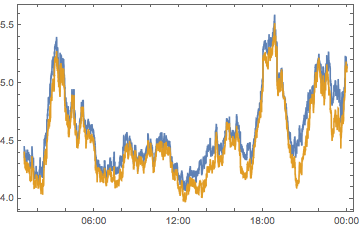
And that does seem to be interpretable (although it’s super funky that the graph doesn’t cycle appropriately). But first let’s just look at how this compares to the questions posted at a given time:
smoothQHMSLength =
  MovingMap[Length, questionHMScores, Quantity[1, "Hours"] ];
Thread[{#["Dates"], Rescale[#["Values"]]}] & /@ {
    smoothQHMS,
    smoothQHMSLength
    } // DateListPlot[#, PlotRange -> All] &

(*Out:*)
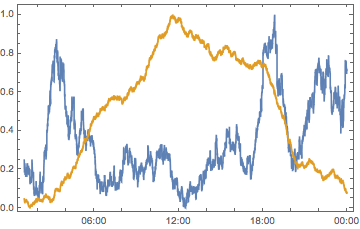
Which is interesting. There are a few possible interpretations for this data:
-
The proportion of users who simply want quick help and don’t care about question quality increases in that middle-of-the-day peak and a falling-tide lowers all ships
-
Around 7:00PM, 9:00 PM and 2:00 AM EST people ask better questions
-
Around 7:00PM, 9:00 PM and 2:00 AM EST people are more prone to up-voting questions
-
There’re some outliers distorting those times
We’ll tackle the last and first of these propositions first, as they’re easiest to treat.
Proposal: Outliers skew the data
First, the outliers:
Select[
   Normal[smoothQHMS],
   Between[#[[2]], {0, 25}] &
   ] // DateListPlot[#, PlotRange -> All] &

(*Out:*)
So that’s clearly not the issue here. Which is really unsurprising given that the highest and lowest question scores are <1000 and the minimum number of questions asked over one of these time periods is 1000.
Proposal: Low-scoring questions drown out the others
For the other, we’ll try removing users who have asked fewer than 5 questions, considering those questions a form of trial-period or whatnot, to learn how best to ask questions.
$userQuestionCounts = $questions[All, "owner", "user_id"] // Normal //
    Counts;
$experiencedUsers = Keys@Select[$userQuestionCounts, GreaterThan[5]];
$experiencedUserQuestions = $questions[
   Select[MemberQ[$experiencedUsers, #["owner", "user_id"]] &]];
experiencedUserQuestionScores =
   TimeSeriesWindow[
     EventSeries@
       AssociationThread[
         FromUnixTime /@
      Lookup[Normal[$experiencedUserQuestions], "creation_date"],
         Lookup[Normal[$experiencedUserQuestions], "score"]
         ],
     {DateObject[{1970}], DateObject[{2017, 6, 30}]}
     ];
Then do the same date renormalization:
experiencedUserQuestionHMScores =
EventSeries[
Thread@{
dateHMReform[experiencedUserQuestionScores["Dates"]],
experiencedUserQuestionScores["Values"]
}
];
smoothEUQS =
MovingMap[Mean, experiencedUserQuestionHMScores,
Quantity[1, "Hours"]];
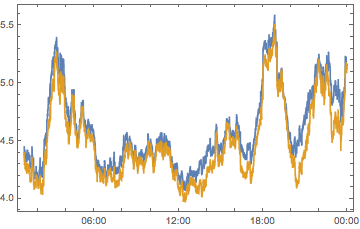
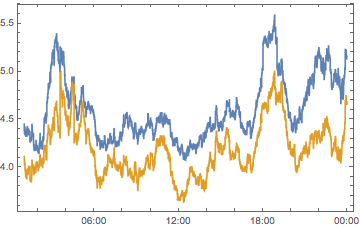
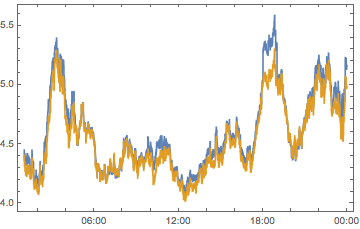
{
smoothQHMS,
smoothEUQS
} // DateListPlot[#, PlotRange -> All] &
(*Out:*)
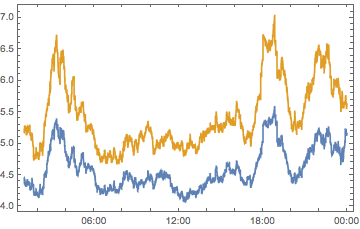
And we see a scaling shift (i.e. each data point seems to be multiplied by some factor rather than having a constant added) but the exact same pattern.
So that leaves us with two discussions left, and unfortunately we’re not yet equipped to look at either of them, so first we really need to identify where those peaks are coming from.
Identiify the Peaks
Let’s first note the three main peaks:
peakDates =
   Pick[
       TimeObject /@ #[[All, 1]],
       GreaterThan[6] /@ #[[All, 2]]
       ] &@
     Pick[
       smoothedEUQS["DatePath"],
       EqualTo[1] /@
         PeakDetect[
           smoothEUQS["Values"],
           250 (*Picked to give 3 distinct points*)
           ]
       ];
peakDates

(*Out:*)

{TimeObject[{3, 18, 17.}, TimeZone -> -4.],
 TimeObject[{18, 50, 6.}, TimeZone -> -4.],
 TimeObject[{21, 59, 32.}, TimeZone -> -4.]}
Now let’s find standard user timezones, where available. First we’re gonna have to pull in all the user data:
$users =
   $so["QueryIterate",
     "Request" -> "Users",
     "site" -> "mathematica"
     ];
$users // Length

(*Out:*)

33541

CloudExport[$users, "MX", "user:b3m2a1/mse_users_list.mx",
 Permissions -> "Public"]

(*Out:*)

CloudObject["https://www.wolframcloud.com/objects/b3m2a1/mse_users_\
list.mx"]
Then we’ll extract time zones by determining location:
userPlaceNames =
   StringSplit[
        If[StringContainsQ[#, "#"], ImportString[#, "HTML"], #],
        "/"] & /@ DeleteMissing@Normal@$users[All, "location"] //
   Flatten;
userCountries =
   Interpreter["Country"][userPlaceNames];
userCities =
   Interpreter["AdministrativeDivision"][
   Pick[userPlaceNames, FailureQ /@ userCountries]];
userTimeZones =
   N@Mean@QuantityMagnitude@
         UnitConvert[EntityValue[#, "OffsetFromUTC"],
        "Hours"] & /@
      EntityValue[
        Cases[_Entity]@
          Join[userCountries, userCities],
        "TimeZones"
        ];
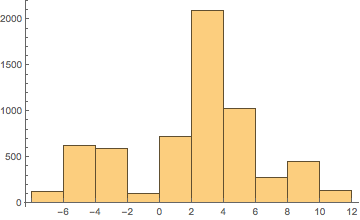
Then build a histogram of these:
Histogram[
  userTimeZones,
  {Range[-8, 12, 2]},
  Ticks -> {Range[-8, 12, 2], Automatic}
  ]

(*Out:*)
Let’s then remap the place names to their values, with the same binning:
KeySelect[IntegerQ]@
      GroupBy[
        Thread[
          CommonName@
             Cases[_Entity]@
               Join[userCountries, userCities] ->

       Round[userTimeZones, 2]
          ],
        Last -> First
        ] // Map[StringRiffle[Keys@ReverseSort@Counts@#, " | "] &] //
  KeySort;
userPlaceNameTZs // Dataset

(*Out:*)

Dataset[ <> ]
So there’re clearly some oddities with my method for computing time zones, but overall we’re in a pretty good state to start looking at what those points could be.
In particular, let’s first assume they correspond to Europe in some way as, of the people who have tagged a location on their account, they’re by far the dominant users of the site — although, just as a sanity check, in terms of a single country the maximum number of users do come from United States.
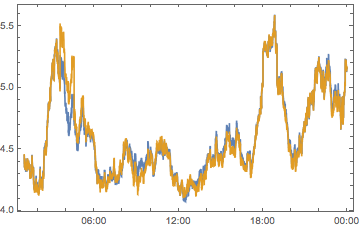
Now moving on, let’s shift that plot above by 6 hours (UTC-4 + UTC+2) with the peaks highlighted:
peakTimeEventSeries = EventSeries@Thread[{peakTimes, 10}];
europeSEUQs =
   {TimeObject@#[[1]], #[[2]]} & /@

    TimeSeriesShift[smoothEUQS, Quantity[6, "Hours"]]["DatePath"] //
   EventSeries;
europePeakTimes =
   {TimeObject@#[[1]], #[[2]]} & /@

    TimeSeriesShift[peakTimeEventSeries, Quantity[6, "Hours"]][
     "DatePath"] // EventSeries;
europeSHMLs =
   {TimeObject@#[[1]], #[[2]]} & /@

    TimeSeriesShift[smoothQHMSLength, Quantity[6, "Hours"]][
     "DatePath"] // EventSeries;
europeScaledSHMLs =
   Thread[{
        #["Dates"],
        Rescale[#["Values"], MinMax@#["Values"],
       MinMax@europeSEUQs["Values"]]
        }] &@europeSHMLs;

Show[
  DateListPlot[{europeSEUQs, europeScaledSHMLs}],
  DateListPlot[
    europePeakTimes,
    Joined -> False,
    Filling -> Axis
    ]
  ]

(*Out:*)
Which is interesting and provides better framing for the question time curve, but also suggests those peaks probably aren’t a pure European effect.
europePeakTimes["Dates"]

(*Out:*)

1:00 AM is plausible, given how many programmers tend to be night-owls, 9:15 is plausible—start of the workday and all that—but 4:00 AM seems odd.
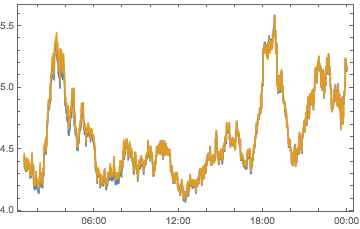
So let’s just quickly look at the same graph for PST:
pstSEUQs =
   {TimeObject@#[[1]], #[[2]]} & /@

    TimeSeriesShift[smoothEUQS, Quantity[-3, "Hours"]]["DatePath"] //
   EventSeries;
pstPeakTimes =
   {TimeObject@#[[1]], #[[2]]} & /@

    TimeSeriesShift[peakTimeEventSeries, Quantity[-3, "Hours"]][
     "DatePath"] // EventSeries;
pstSHMLs =
   {TimeObject@#[[1]], #[[2]]} & /@

    TimeSeriesShift[smoothQHMSLength, Quantity[-3, "Hours"]][
     "DatePath"] // EventSeries;
pstScaledSHMLs =
   Thread[{
        #["Dates"],
        Rescale[#["Values"], MinMax@#["Values"],
       MinMax@pstSEUQs["Values"]]
        }] &@pstSHMLs;

Show[
  	DateListPlot[{pstSEUQs, pstScaledSHMLs}],
  	DateListPlot[
    		pstPeakTimes,
    		Joined -> False,
    		Filling -> Axis
    		]
  	]

(*Out:*)
pstPeakTimes["Dates"]

(*Out:*)

These times do seem pretty reasonable for bouts of activity. So let’s just try cutting out the PST users. Maybe they’re just particularly good. First we need to remap the actual user location strings to their timezones:
userPlaceNameTimes =
   AssociationThread[
     DeleteMissing@Normal@$users[All, "location"],
     Replace[
       DeleteMissing@Normal@$users[All, "location"],
       Normal[
         KeyMap[_?(StringContainsQ[#]) &]@
           AssociationThread[
             userPlaceNames ->
               Lookup[
                 AssociationThread[
                   Cases[_Entity]@
                     Join[userCountries, userCities],
                   Round[userTimeZones, 2]
                   ],
                 ReplacePart[
                   userCountries,

          Thread[Position[userCountries, _Failure] -> userCities]
                   ],
                 \[Infinity]
                 ]
             ]
         ],
       1
       ]
     ];
Then pick the users to drop:
pstUserIDs =
   Pick[
     Normal@$users[All, "user_id"],
     MatchQ[-6 | -8] /@

    Lookup[userPlaceNameTimes, Normal@$users[[All, "location"]]]
     ];
Then for testing we’ll generalize that function for generating a comparative peak plot:
compPeakData[userSel : Except[_List],
exclude : True | False : True] :=
compPeakData[
Pick[
Normal@$users[All, "user_id"],
userSel /@
Lookup[userPlaceNameTimes, Normal@$users[[All, "location"]]]
],
exclude
];
compPeakData[l_List, exclude : True | False : True] :=
compPeakData[l, exclude] =
Module[{a = <||>},
a["Users"] = l;
a["Questions"] =
$questions[
Select[If[exclude, Not, Identity]@
MemberQ[a["Users"], #["owner", "user_id"]] &]];
a["EventSeries"] =
TimeSeriesWindow[
EventSeries@
AssociationThread[
FromUnixTime /@
Lookup[Normal[a["Questions"]], "creation_date"],
Lookup[Normal[a["Questions"]], "score"]
],
{DateObject[{1970}], DateObject[{2017, 6, 30}]}
];
a["HourMinuteSeries"] =
EventSeries[
Thread@{
dateHMReform[a["EventSeries"]["Dates"]],
a["EventSeries"]["Values"]
}
];
a["SmoothData"] =
MovingMap[Mean, a["HourMinuteSeries"],
Quantity[1, "Hours"]];
a
];
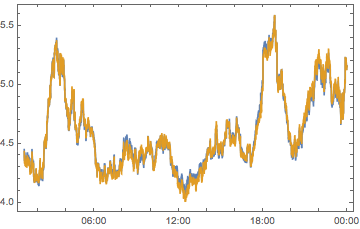
compPeakPlot[userSel_, exclude : True | False : True] :=
{
smoothQHMS,
compPeakData[userSel, exclude]["SmoothData"]
} // DateListPlot[#, PlotRange -> All] &
And for the PST people:
compPeakPlot[MatchQ[-8 | -6]]

(*Out:*)
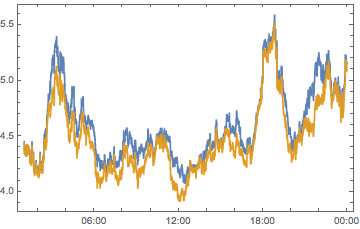
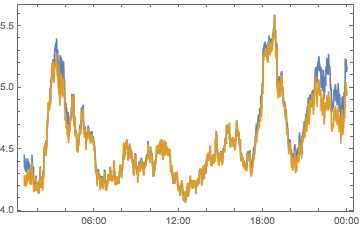
So that’s clearly not it, although dropping them clearly does lower the overall quality. But while we’re here let’s just try dropping all the users who’ve put in a location:
compPeakPlot[IntegerQ]

(*Out:*)
And that decreases some of those peak intensities, but only one peak is really washed out significantly. And we’ll just roll through the landscape, then, dropping in timezones, to see who affects what and how much.
compPeakPlot[Between[{#, # + 1}]] & /@ Range[-12, 12, 2] //
  ArrayReshape[#, {3, 4}] & // Grid

(*Out:*)


All told, we can see we don’t have quite enough to determine who is causing what. But we can see that there are timezones with a big effect, chiefly -6, -4, 2 and 10 So let’s look at these on their own:
DateListPlot[
  compPeakData[Between[{#, # + 1}], False]["SmoothData"] & /@ {-6, -4,
    2, 10},
  PlotLegends -> {-6, -4, 2, 10},
  PlotRange -> All
  ]

(*Out:*)
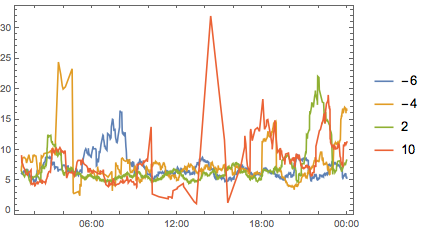
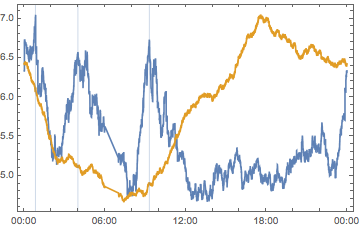
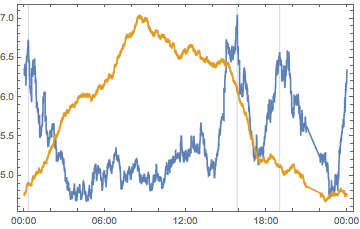
And just for ease of viewing let’s split that up:
MapIndexed[
    DateListPlot[
       Thread[{TimeObject /@ #[[All, 1]], Rescale@#[[All, 2]]}] &@
          TimeSeriesShift[
             compPeakData[Between[{#, # + 1}], False]["SmoothData"],
             Quantity[4 + #, "Hours"]
             ]["DatePath"] // EventSeries,
       PlotLegends -> {#},
       PlotRange -> All,
       PlotStyle -> ColorData[97][First@#2]
       ] &,
    {-6, -4, 2, 10}
    ] // ArrayReshape[#, {2, 2}] & // Grid

(*Out:*)
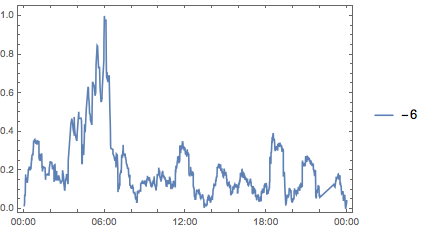
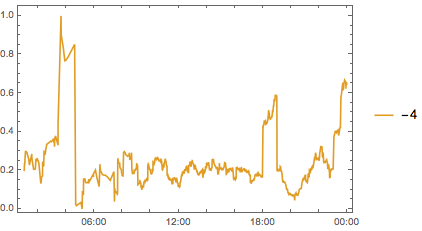
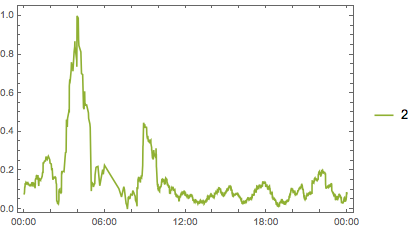
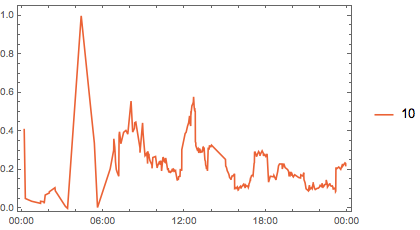
And finally we get some sense for what’s going on. It seems it’s that early morning period (2-6 AM). Questions posted then are disproportionately likely to be high scoring. So now we can return to our two ideas, but updated to take this into account:
-
In the early morning people ask better questions
-
In the early morning people are more prone to up-voting questions
Proposal: Up-Voting Rates
Initially, this would seem to be the more plausible of the two, simply by exclusion. How is it likely that people are asking their best questions early in the morning? Unfortunately we’d need to sample the API at many different time points to get a sense for how true this is (pulling the newest ~50 or so questions) and so that cannot be evaluated right now.
Proposal: Better Questions
On the other hand, the “better questions” hypothesis isn’t actually as dead as one might think. The reason being that if someone is on the Stack Exchange so late at night it likely means one of two things:
-
they’re clearly committed to it
-
they’ve got a problem they spent the evening trying to solve and couldn’t
Both of those could plausibly lead to good questions. Even more, though, assuming being up late saps a person of their willingness to dig deep into problems that come up, they may in fact post *easier* questions than usual. And easier questions (or, even more generally, broader questions) may have wider appeal.
Obviously this is an unprovable proposal, where as the up-voting rates is theoretically provable, but I personally think there is something to be said for the “better questions get asked late at night” idea. In any case, it’s been a fun dive into a seemingly simple question: “when do higher-scoring questions get asked” which took a few unanticipated turns.