Questions on The Mathematica Stack Exchange
Having built out a framework for developing custom hook-ins to ServiceConnect it’s worth now seeing what we can do with that. There are lots of interesting APIs to connect to, of course, but we’ll start with a relatively simple one, the Stack Exchange API . The API is simple, as is the authentication procedure, and it’s easy to understand the data we pull out, making it a good test case. We’ll start by connecting via my service connection. If you don’t have the connection you can install it like this:
PacletInstall@
   URLBuild@{
      "http://www.wolframcloud.com/objects/b3m2a1.paclets/paclets/\
PacletServer/Paclets",
      "ServiceConnection_StackExchange-1.0.0.paclet"
      };
With that installed you can proceed to connect:
$so = ServiceConnect["StackExchange"]
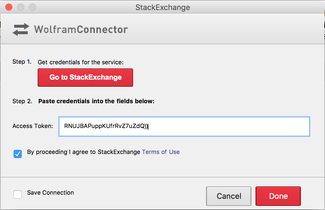
This will pop open an authentication dialog, where you click on the Go to StackExchange button, authorize the connection, and it redirects you to a URL where it displays the code to copy in:
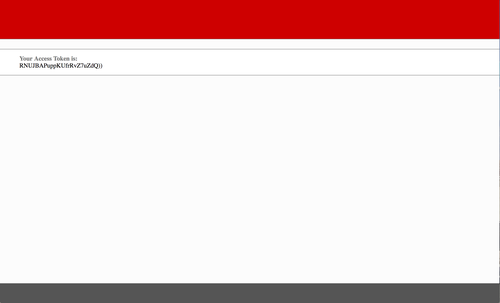
Copying that in and clicking Done
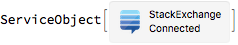
And we’re rewarded with our connection
(*Out:*)
Now we can start to do stuff of real interest.
Importing the Stack Exchange
Eventually we’ll get to some proper analysis of Stack Exchange data with this connection, but first we’ll look at the connection itself.
As with all the connections it supports the "Requests" meta request:
$so["Requests"]

(*Out:*)

{"AnswerQuestion","Answers","Authentication","Comment","ID","Information","Logout","Me","Messages","Name","Notifications","QueryContinue","QueryIterate","QuestionAnswers","QuestionComments","Questions","QuotaMax","QuotaRemaining","RawRequests","RequestData","RequestParameters","Search","SiteEvents","SiteInfo","Sites","UnreadMessages","UnreadNotifications","UserID","Users"}
And we can see that, as with all my connections, it supports the "RequestsParameters" request. We’ll give that a look on the "Questions" request:
$so["RequestParameters", "Request" -> "Questions"]

(*Out:*)

<|"Parameters"->{"id","site","page","pagesize","fromdate","todate","order","min","max","sort","tagged"},"Required"->{"site"}|>
And we’ll give this a quick test, we’ll use the Mathematica Stack Exchange as our "site" , and we’ll restrict the "pagesize" to 10 (for readability I dropped most of the data):
$so["Questions", "site" -> "mathematica", "pagesize" -> "10"][All,
  <|
    "title" -> "title",
    "user" -> Function[Key["display_name"]@#owner],
    "creation_date" -> Function[FromUnixTime@#["creation_date"]],
    "score" -> "score"
    |>
  ]

(*Out:*)
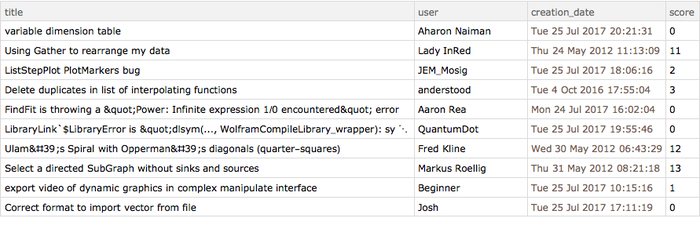
We can see there’s info on users, creation / modification dates, titles, scores, etc. So this alone is a pretty rich dataset to work with.
So on the topic of actually importing it, we see in the request listing there’re these requests "QueryContinue" and "QueryIterate" and if we look at what we get for "QueryContinue" :
$so["QueryContinue"]

(*Out:*)

True
It tells us there’s more to import (obviously – the Stack Exchange itself tells us it has about 45k questions on it).
So then looking at the parameters of "QueryIterate"
$so["RequestParameters", "Request" -> "QueryIterate"]

(*Out:*)

<|"Parameters"->{__},"Required"->{"Request"}|>
It informs us it can take any parameters and the only required parameter is a "Request" . So we can set up an importer for *all* the data:
$data =
   $so["QueryIterate",
     "Request" -> "Questions",
     "site" -> "mathematica"
     ];
$data // Length

(*Out:*)

44812
Seems about right. Now for future use let’s export this up to the cloud.
CloudExport[$data, "MX", "mse_question_list.mx",
 Permissions -> "Public"]

(*Out:*)

CloudObject[https://www.wolframcloud.com/objects/user-affd7b1c-ecb6-4ccc-8cc4-4d107e2bf04a/mse_question_list.mx]
And with the question data downloaded we can proceed to analyzing it.
Dates of the Stack Exchange
If you want to just start in on working with the data, start with this:
$data =
   CloudImport@
      "https://www.wolframcloud.com/objects/b3m2a1/mse_question_list.\
mx";
First let’s just see what we have:
First@$data // Keys // Normal

(*Out:*)

{"tags","owner","is_answered","view_count","answer_count","score","last_activity_date","creation_date","question_id","link","title"}
So maybe we’ll start with looking at posting dates. These things are in Unix time so we’ll need to use the FromUnixTime function to convert them to DateObject .
$dates =
   FromUnixTime /@ $data[All, "creation_date"];
And we’ll just start with a DateHistogram
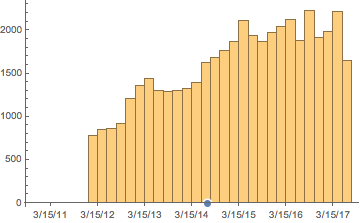
DateHistogram[$dates]

(*Out:*)

Pretty plain. Shows a consistent increase over time with an interesting plateau through 2013. If we find the release date for Version 10, by finding the introduction date of Entity , which was new as of 10.0:
WolframLanguageData["Entity", "DateIntroduced"]

(*Out:*)

And then show it on our plot:
Show[
 DateHistogram[$dates],
 TimelinePlot[{DateObject[{2014, 7, 9}, "Day", "Gregorian", -4.]}]
 ]

(*Out:*)
We see it lines up pretty much exactly with the spike in questions asked, interestingly if we do the same with Version 11:
WolframLanguageData["NetTrain", "DateIntroduced"]

(*Out:*)

Show[
 DateHistogram[$dates],
  TimelinePlot[{
     DateObject[{2014, 7, 9}, "Day", "Gregorian", -4.],
     DateObject[{2016, 8, 8}, "Day", "Gregorian", -4.]
     }]
  ]

(*Out:*)
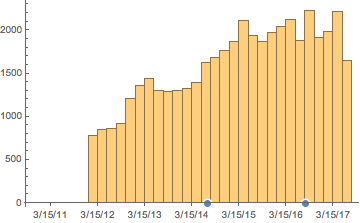
We don’t see quite the same spike. This might simply reflect the lack of time since the release, however. It took about a year for 10 to hit peak question, it seems.
In any case let’s just look at all of the introduction dates since 2011:
Show[
 DateHistogram[$dates],
  TimelinePlot[{
     EntityValue[
         "WolframLanguageSymbol",
         "DateIntroduced"
         ] // DeleteDuplicates //

    Select[GreaterThan[
      DateObject[{2011, 1, 1}, "Day", "Gregorian", -4.]]]
     }]
  ]

(*Out:*)

The first thing to note is that WRI must have changed their versioning system starting with 10.0 (lots of point releases compared to 9.0). The second is that there’s a clear spike whenever a new major version is released, which I think shows that WRI is in fact putting in a lot of new functionality each release. And also that lots of it is glitchy…
Unfortunately here we’re missing lots of the data from before Mathematica StackExchange was a thing, so let’s quickly import those questions we’re missing:
$soaddition =
   Join[
     $so["QueryIterate",
       "Request" -> "Questions",
       "site" -> "stackoverflow",
       "tagged" -> "wolfram-language"
       ],
     $so["QueryIterate",
       "Request" -> "Questions",
       "site" -> "stackoverflow",
       "tagged" -> "wolfram-mathematica"
       ]
     ];
$soaddition // Length

(*Out:*)

3697
And we see were were only missing a paltry ~3.5k questions on our stack of ~45k. But we’ll add them in and see how things change:
Show[
  DateHistogram[
    Join[$dates, FromUnixTime /@ $soaddition[All, "creation_date"]]
    ],
  TimelinePlot[{
     EntityValue[
         "WolframLanguageSymbol",
         "DateIntroduced"
         ] // DeleteDuplicates //

    Select[GreaterThan[
      DateObject[{2009, 1, 1}, "Day", "Gregorian", -4.]]]
     }]
  ]

(*Out:*)
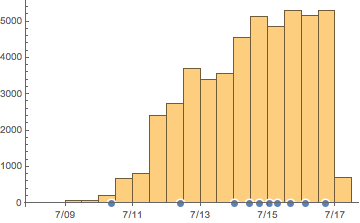
And so maybe there was a spike for version 8.0, but if there was it is nearly indiscernible in the context of our entire dataset so lets look at in its own context:
Show[
  DateHistogram[FromUnixTime /@ $soaddition[All, "creation_date"]],
  TimelinePlot[{
     EntityValue[
         "WolframLanguageSymbol",
         "DateIntroduced"
         ] // DeleteDuplicates //

    Select[GreaterThan[
      DateObject[{2009, 1, 1}, "Day", "Gregorian", -4.]]]
     }]
  ]

(*Out:*)
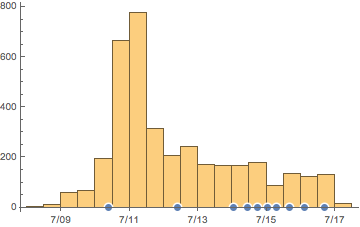
And there we can see the spike, before the Mathematica Stack Exchange develops and crushes it.
That is, I think, enough for now, but at some future date we’ll come back to this and look at how / if posting time of day / year correlates to question score.